
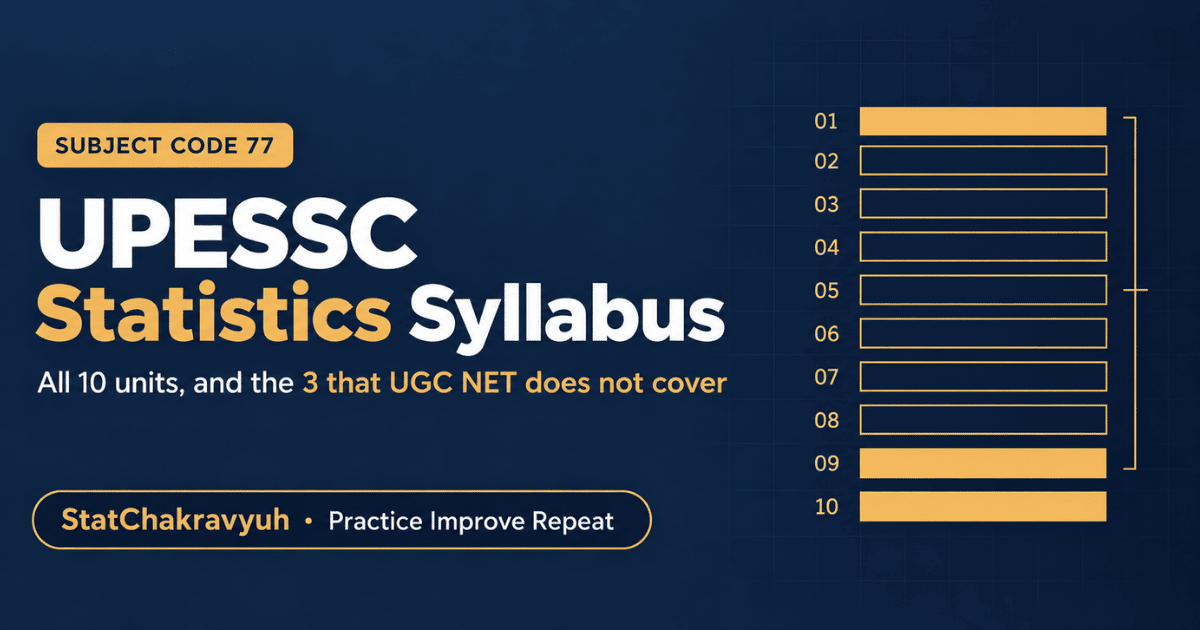
Quick answer. The UPESSC Assistant Professor Statistics syllabus, subject code 77, has ten units: Probability Theory, Distribution Theory, Statistical Methods, Statistical Quality Control and Time Series, Demography and Index Number, Statistical Inference, Sampling Theory, Linear Estimation and Design of Experiments, Multivariate Analysis, and Advance Probability Theory. The written paper asks 90 Statistics questions and 30 General Knowledge questions, for 360 marks in 2 hours, with negative marking.
The official syllabus PDF is published on UPHESC letterhead, the commission’s former name. It is the correct and current document.
The Ten Units
| Unit | Title | Familiar from NET? |
|---|---|---|
| 1 | Probability Theory | Yes |
| 2 | Distribution Theory | Yes |
| 3 | Statistical Methods | Mostly |
| 4 | Statistical Quality Control and Time Series | Partly. SQC is new. |
| 5 | Demography and Index Number | No |
| 6 | Statistical Inference | Yes |
| 7 | Sampling Theory | Yes |
| 8 | Linear Estimation and Design of Experiments | Yes |
| 9 | Multivariate Analysis | Yes |
| 10 | Advance Probability Theory | No |
Roughly seventy percent of this syllabus overlaps with UGC NET Statistics. The three highlighted rows are where the work actually is.
Unit 1: Probability Theory
Random experiment: trial, sample point, sample space. Definitions of equally likely, mutually exclusive and exhaustive events. Events class.
Definition of probability: classical, relative frequency and axiomatic approaches, with their properties, merits and demerits.
Total and compound probability theorems. Conditional probability. Independence of events. Bayes’ theorem and its applications.
Note the phrase “merits and demerits of these approaches”. That is a comparison question waiting to be asked, and it is the kind of thing a calculation focused candidate skips.
Unit 2: Distribution Theory
Discrete random variables. Concept, probability mass function, distribution function. Joint probability mass function of several discrete random variables, marginal and conditional probability mass functions.
Continuous random variables. Probability density function, distribution function, joint density function of two continuous variables, marginal and conditional density functions, independence of random variables.
Expectation and generating functions. Mathematical expectation, moments, factorial moments, moment generating function and its properties and uses, probability generating function.
Inequalities and convergence. Chebyshev’s inequality and its applications, Markov’s inequality, basic ideas of convergence in probability and convergence in distribution, functions of random variables.
Standard distributions. Bernoulli, binomial, Poisson, geometric, negative binomial, hypergeometric, multinomial, uniform, normal and its relationship with the binomial and Poisson distributions, Cauchy, and the bivariate normal with its marginal and conditional distributions.
Unit 3: Statistical Methods
Data. Concept of statistical population and sample, classification of data, quantitative and qualitative data, ordinal and nominal data, time series and cross sectional data, multivariate data.
Presentation. Construction of tables with one or more factors, diagrammatic and graphical representation of grouped data, frequency and cumulative frequency distributions and their applications, histogram, frequency polygon, ogives, stem and leaf charts, box plot.
Descriptive measures. Central tendency and its measures, partition values, dispersion and relative dispersion, moments, Sheppard’s correction for moments, without derivation, skewness, kurtosis and their measures.
Bivariate data. Scatter diagram, product moment correlation coefficient and its properties, coefficient of determination, correlation ratio, intraclass correlation, concept of error in regression, principle of least squares, fitting of linear regression, rank correlation.
Partial and multiple correlation in three variables, their measures and related results.
Theory of attributes. Independence and association of attributes, various measures of association for two way classified data.
Correlation ratio, intraclass correlation, Sheppard’s correction and theory of attributes are all named here and none of them appear in UGC NET Statistics. They are short topics and they are cheap marks if you cover them.
Unit 4: Statistical Quality Control and Time Series
Statistical Quality Control
Quality of a product, need for quality control, basic concept of process control, process capability and product control.
General theory of control charts, causes of variation in quality, control limits, sub grouping, summary of out of control criteria.
Charts for attributes: p chart, np chart, c chart. Charts for variables: mean and range chart, mean and standard deviation chart.
Acceptance sampling. Principle of acceptance sampling, problem of lot acceptance, stipulation of good and bad lots, producer’s and consumer’s risks, single and double sampling plans, their OC functions, concepts of AQL, LTPD and AOQL, average amount of inspection and ASN function.
Measurement of Fertility
Crude birth rate, general fertility rate, age specific birth rate, total fertility rate, gross reproduction rate, net reproduction rate, logistic model for population projection.
Time Series Analysis
Economic time series, different components, illustration, additive and multiplicative models, determination of trend, seasonal and cyclical fluctuations.
Statistical quality control is entirely absent from UGC NET Statistics. Control charts, OC curves, AQL, LTPD, AOQL and the ASN function are a self contained body of definitions and formulas. It is learnable in a week and it is examined directly.
Note also that the time series treatment here is classical decomposition only. There is no ARIMA, no ACF and PACF, no spectral analysis. That is much lighter than UGC NET.
Unit 5: Demography and Index Number
Measurement of Mortality and Life Table
Crude death rate, standardized death rates, age specific death rates, infant mortality rate, death rate by cause. Complete and abridged life table and its main features, uses of life table.
Index Numbers
Price relatives and quantity or volume relatives. Link and chain relatives, composition of index numbers.
Laspeyres, Paasche, Marshall Edgeworth and Fisher index numbers. Chain base index number, tests for index numbers, cost of living index number.
This unit is entirely absent from UGC NET Statistics, GATE ST and IIT JAM. It is also one of the most learnable units in the whole syllabus, because life tables and index numbers are formula driven with a fixed structure.
If you are short on time, this unit gives a better return per hour than almost anything else here.
Unit 6: Statistical Inference
Sampling distributions. Derivation of chi square, t, F and Z distributions. Beta, Gamma and Laplace densities.
Point estimation. Properties of estimators, mean square error and minimum mean square error estimator, unbiasedness, minimum variance unbiased estimator, Cramer Rao lower bound, amount of information, consistency and sufficient conditions for consistency, relative efficiency, asymptotic efficiency.
Sufficiency, factorization theorem without proof, complete sufficient statistics, Rao Blackwell theorem, completeness and sufficiency, Lehmann Scheffe theorem, one parameter exponential family and its completeness, Cramer Rao inequality, best linear unbiased estimator.
Methods of estimation. Moments, maximum likelihood, minimum chi square, least squares with examples, BAN and CAN estimators, point estimates of measures of location, dispersion, regression and correlation.
Interval estimation. Confidence interval and confidence coefficient, confidence intervals for parameters of the univariate normal, two independent normal distributions and the exponential distribution.
Testing of hypotheses. Statistical hypotheses, critical region, size and power of a test, most powerful test, randomized and non randomized tests, Neyman Pearson lemma and its applications, uniformly most powerful unbiased test, power, likelihood ratio test and its applications, functions of UMP with simple illustration.
Applications of chi square, t, F and z distributions in tests of significance.
Likelihood ratio test, unbiased test, Neyman Pearson lemma for randomized tests, randomized test for binomial and Poisson distributions, chi square test of goodness of fit, test of equality of several variances, significance test for correlation coefficient.
Randomized tests and BAN and CAN estimators are named explicitly here and are not in UGC NET. They are small additions to a unit you otherwise already know.
Unit 7: Sampling Theory
Concept of population and sample, need for sampling, complete enumeration versus sampling, basic concepts, sampling and non sampling errors.
Simple random sampling with and without replacement, estimation of population mean and proportion and their standard errors.
Stratified random sampling. Proportional and optimum allocation, comparison with simple random sampling for fixed sample size. Post stratification, double sampling with post stratification.
Ratio, product and regression methods of estimation, estimation of population mean, evaluation of bias and variance to the first order of approximation, comparison with simple random sampling.
Systematic sampling. Cluster sampling with equal clusters. Two stage sampling.
Unequal probability sampling. PPSWR and PPSWOR methods of sample selection, including the cumulative total method and Lahiri’s scheme. Comparison of SRSWR and PPSWR schemes. Ordered estimators of Des Raj and Murthy for n equals 2. Construction of unordered estimators from ordered estimators. Horvitz Thompson estimator of a finite population total or mean, expression for its variance, unbiased estimator of the variance, Yates Grundy modification.
Non sampling errors with special reference to non response. Hansen and Hurwitz estimator for population mean. Concept of randomized response and well known randomized response techniques for sensitive characteristics.
This unit goes deeper than UGC NET. Lahiri’s scheme, Des Raj and Murthy estimators, the Yates Grundy modification, the Hansen and Hurwitz estimator and randomized response techniques are all named here and are not in the NET syllabus.
Unit 8: Linear Estimation and Design of Experiments
Linear models. General linear model, assumptions, estimation of parameters by least squares, estimable functions, error and estimation space, Gauss Markov theorem.
Distribution of quadratic forms and application in the analysis of variance model, estimable linear hypothesis, generalized F and t tests.
Analysis of variance. One way ANOVA, two way ANOVA with single observation per cell and with equal numbers of observations per cell, Tukey’s test.
Basic designs. Randomization, replication, local control. Completely Randomized Design, Randomized Block Design, Latin Square Design, missing plot technique.
Block designs. General block design and its information matrix C. Criteria for connectedness, balance and orthogonality. Intra block analysis. Incomplete block design, Balanced Incomplete Block Design.
Factorial experiments. General factorial experiments, factorial effects, study of 2 to the n and 3 to the n factorial experiments in randomized blocks, complete and partial confounding, construction of confounded factorial experiments, split plot experiment.
Unit 9: Multivariate Analysis
Multivariate normal distribution, its moment generating function and characteristic function, marginal and conditional distributions, multiple and partial correlation coefficients.
Maximum likelihood estimators of the mean vector and covariance matrix. Distribution of the sample mean vector. Null distribution of the sample correlation coefficient, sample multiple and partial correlation coefficients and their null sampling distributions, distribution of the sample regression coefficient.
Null and non null distribution of Hotelling’s T squared statistic. Applications in tests for the mean vector of one and more multivariate normal populations, and for equality of components of a mean vector.
Mahalanobis D squared. Wishart distribution and its properties.
Classification and discrimination. Procedures for discrimination between two multivariate normal populations, sample discriminant function and associated tests, probabilities of misclassification and their estimation, classification into more than two multivariate normal populations, Fisher Behrens problem.
Unit 10: Advance Probability Theory
This is the unit that decides the paper for most candidates.
Measure theory foundations. Classes of sets, fields, sigma fields, minimal sigma field, Borel sigma field, sequence of sets, limit superior and limit inferior of a sequence of sets, measure, probability measure, properties of measure, Caratheodory extension, Lebesgue and Lebesgue Stieltjes measures.
Measurable functions and integration. Measurable functions, random variables, sequence of random variables, integration of a measurable function with respect to a measure, monotone convergence theorem, Fatou’s lemma, dominated convergence theorem.
Characteristic functions. Characteristic function, uniqueness theorem, Levy’s continuity theorem, statement only, convergence in distribution, convergence in probability, almost sure convergence.
Decomposition and inequalities. Decomposition of distribution functions into purely discrete, absolutely continuous and singular components. Holder’s inequality, Minkowski inequality, Lyapunov and Kolmogorov inequalities.
Laws of large numbers. Weak and strong laws, Khintchine theorem, Kolmogorov strong law, Borel zero one law, Borel Cantelli lemma.
Weak convergence. Weak and complete convergence of sequences of distribution functions, weak compactness theorem, Helly Bray lemma and theorem, characteristic functions, inversion theorem.
Central Limit Theorem. One dimensional case, Lindeberg Levy for independent and identically distributed random variables.
Nothing in this unit appears in UGC NET Statistics, GATE ST or IIT JAM. It is measure theoretic probability at postgraduate level, and for most candidates it is genuinely new material rather than revision.
Start here, not last. It is the unit with no shortcut, and it is where a well prepared candidate separates from a NET qualified one.
Where the 90 Questions Come From
The commission does not publish a unit wise question distribution, so any weightage chart you see is an estimate. What can be said with certainty is this.
Ninety Statistics questions across ten units averages nine per unit. Whether the actual paper is even or skewed, a unit you have skipped entirely is a unit you cannot answer at all.
With negative marking at minus one, guessing on a unit you never studied is not a neutral act. It costs you.
A Sensible Order of Study
| Order | Unit | Why here |
|---|---|---|
| 1 | Unit 10, Advance Probability | Hardest, most new, needs the most time |
| 2 | Unit 5, Demography and Index Number | Entirely new, but formula driven and quick |
| 3 | Unit 4, Statistical Quality Control | New, self contained, learnable in a week |
| 4 | Units 1, 2, 6 | Largely revision if you cleared NET |
| 5 | Units 7, 8, 9 | Revision, with a few named additions to check |
| 6 | Unit 3 | Mostly familiar, check the four unusual topics |
| Throughout | General Knowledge, 30 questions | Do not leave this until November |
The three new units sit first deliberately. Everything else is revision for a NET qualified candidate, and revision compresses. New material does not.
Frequently Asked Questions
How many units are in the UPESSC Statistics syllabus?
Ten units under subject code 77.
What is the subject code for Statistics in UPESSC?
77.
Is the UPESSC Statistics syllabus the same as UGC NET Statistics?
No. Roughly seventy percent overlaps. UPESSC additionally includes Statistical Quality Control, Demography and Index Numbers, and Advance Probability Theory with measure theory, none of which are in the UGC NET syllabus.
Is measure theory in the UPESSC Statistics syllabus?
Yes. Unit 10 covers sigma fields, Lebesgue and Lebesgue Stieltjes measures, measurable functions, the monotone convergence theorem, Fatou’s lemma, the dominated convergence theorem, the Borel Cantelli lemma and the Lindeberg Levy Central Limit Theorem.
How many Statistics questions are in the written paper?
Ninety Statistics questions and thirty General Knowledge questions, 120 in total, for 360 marks in two hours.
Is there a unit wise weightage for UPESSC Statistics?
The commission does not publish one. Any weightage chart online is an estimate based on previous papers.
Where can I download the official syllabus?
The Statistics syllabus for subject code 77 is published on the commission website. It appears on UPHESC letterhead, which is the commission’s former name, and is the correct current document.